Topographic map with aerial photo of a factory
A drone captured aerial photos that were processed into an orthophoto and overlaid on the factory site's topographic map, used as a base for design and layout
- Orthophoto
- Topographic Map
SPN's topographic survey services cover ground and coordinate survey, aerial survey by drone and LiDAR, hydrographic survey, and earthwork volume and layout work. Nationwide service, delivering AutoCAD files, orthophotos, point clouds and reports certified by a COE-licensed engineer.
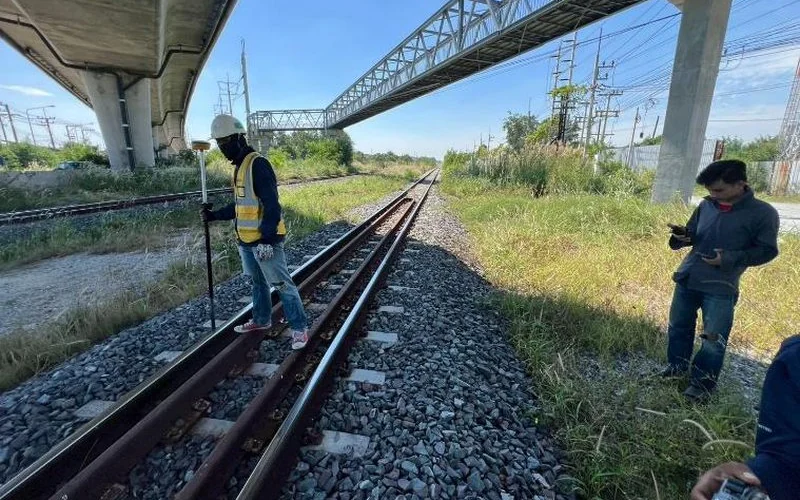
A topographic survey measures the position, level and shape of a site to produce maps and drawings for design and construction. SPN chooses the survey method by site size, required accuracy and budget: GPS RTK and Total Station for detailed work, drones and LiDAR for large areas, and depth sounding for rivers, coastlines and reservoirs. The results can be used for design and building-permit submissions.




Examples from the project images above
A drone captured aerial photos that were processed into an orthophoto and overlaid on the factory site's topographic map, used as a base for design and layout
A survey map marking borehole locations, so the soil investigation layout matches the building plan and uses the same coordinates as the construction drawings
Layout plan and 3D model of the Zone A cut slope at EL+218.500 for hillside site grading, used together with slope and retaining wall design
Ground survey gives the highest accuracy and is the backbone of design and construction. SPN uses GPS RTK in open areas and a Total Station where satellite signals are blocked, tying all work to one set of control points
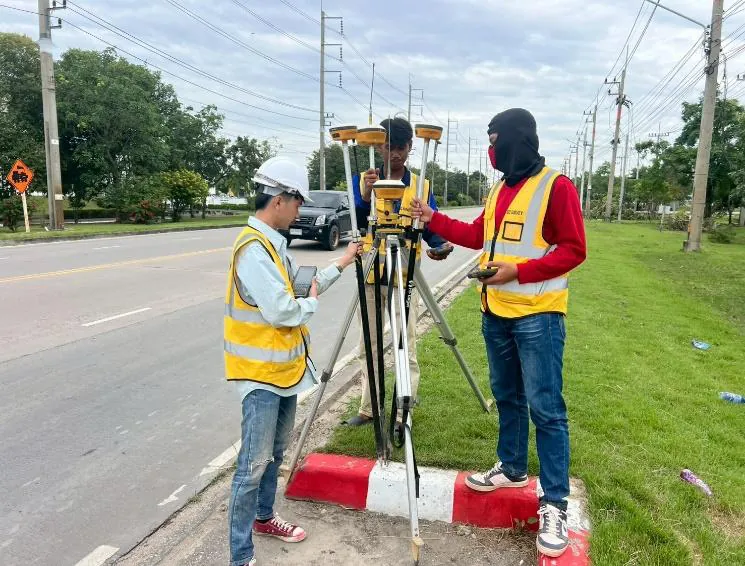
Contour maps and spot levels across the whole site with ±1–3 cm accuracy (about ±1–2 cm horizontal, ±2–3 cm vertical). Supports WGS84 and Indian 1975 (UTM Zone 47N/48N). Best for large open sites and work that needs global coordinates
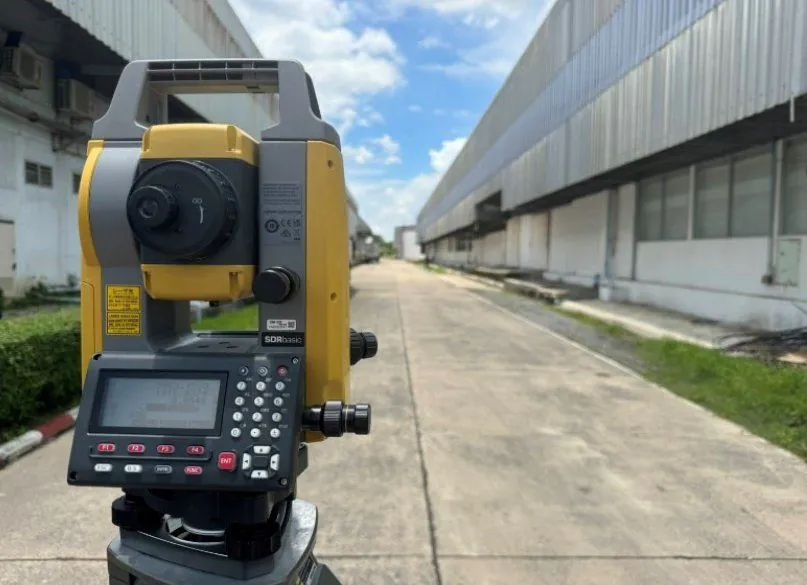
Coordinate and level survey with ±5 mm accuracy using a Topcon SDR. Best for urban areas, factories and spots where buildings or trees block satellite signals. Used to survey buildings, road alignments and utility pipes

Builds a network of control points and benchmarks so the project uses one coordinate set from survey and design through construction. Delivered as a control point list with photos and a location plan
Levelling with an automatic level and staff, carrying MSL levels from reference benchmarks into the project, and repeat surveys at set intervals to monitor settlement or movement of buildings, roads and embankments. Can be combined with instrumentation work

Alignment survey for roads, railways, water pipelines and power lines, with longitudinal profiles and cross-sections at the specified intervals, for design and quantity estimates

Sets out piles, footings, building lines and road alignments to design coordinates with a Total Station together with GPS RTK, and re-checks before work starts to prevent construction in the wrong position

Surveys the position and level of completed work and compares them with the construction drawings for acceptance. Produces as-built drawings for submission and as a record for future maintenance

Picks up the position and level of visible surface features such as manhole covers, pipeline markers, high-voltage poles, fire hydrants, fences and buildings onto the topographic map, so designers can avoid existing utilities
Drones capture large areas many times faster than walking surveys. Photogrammetry is used for open areas and LiDAR for areas with trees or vegetation. Drone accuracy is typically ±3–5 cm when GCPs are used

High-resolution aerial photos for site assessment, project planning and management reports. Pilots are registered with CAAT, and SPN coordinates flight permits in controlled airspace
Processes drone images with ground control points (GCP) into a true-scale orthophoto that can be measured directly for distance and area. Used to overlay site plans, for town planning and in GIS
Creates point clouds, Digital Surface Models (DSM) and Digital Terrain Models (DTM) from drone photogrammetry with ±3–5 cm accuracy. Used to analyse slopes and drainage flow and to calculate earthworks
Laser scanning from a drone or a terrestrial scanner. Some laser pulses pass through gaps in foliage to the ground, giving the true ground surface (bare-earth DTM) in plantations, forest or dense vegetation. Delivered as a point cloud with ground points classified
Repeat flights at set intervals, comparing orthophotos and surface models from each round to track progress, actual earthwork quantities and the accuracy of the work
Drone thermal infrared imaging to find abnormal hot spots and signs of leakage, and multispectral imaging for agriculture and solar projects
Depth and bed condition data are used to design bridges, ports, dredging and bank protection. The method is chosen by channel width, required resolution and budget. Can be combined with over-water soil boring

Depth measurement with a single-beam echo sounder and GNSS on a survey boat, producing depth contour maps and riverbed cross-sections for bridge, pier, dredging and bank protection design
Multibeam sweeps a wide swath of sound to model the full bed at high resolution, while side-scan sonar images the bed to find obstructions, debris and pipelines before dredging, pipe laying or driving piles in water
Surveys the bed profile of rivers and canals and the banks, identifying scour around bridge piers and sediment build-up. Used to design bridge foundations, ports and riverbank protection
Seabed and coastal survey for ports, breakwaters and coastal erosion protection, plus storage volume of reservoirs and ponds for water management and sediment tracking
Send coordinates, a Google Maps link or a KMZ file and tell us what the data will be used for. SPN will recommend the right survey method, resolution and deliverables, with a quotation within 24 hours.
Work that builds directly on survey data, used to estimate earthwork costs, accept work, count stock and prepare the site before soil investigation

Compares the existing ground with design levels, or the ground before and after earthworks, to calculate cut and fill volumes with a cut/fill map. Used for cost estimates and earthwork acceptance
Surveys stockpiles of sand, rock, soil, coal or other materials by drone or GPS RTK, builds a surface model and calculates inventory volume. Used for stock counts and to check material received and issued
Sets out boreholes to the engineer's layout and surveys the actual coordinates and collar levels, producing a borehole location plan for the soil investigation report. One team handles it all in a single job.
Packages commonly used for each project type. SPN engineers adjust the actual scope to site size, site conditions and how the data will be used
Topographic map and orthophoto for laying out panels and internal roads, drainage design, and locating pile test and soil boring points
Existing levels across the site for fill level design, fill volume calculation, and building setting out when construction starts
Route survey with cross-sections at every interval, picking up existing utilities along the route, for design and quantity estimates
Water depth, channel cross-sections and riverbank topography for pier, jetty and dredging design
Repeat surveys at set intervals to calculate excavated volume and inventory, and to monitor pit slopes
Borehole setting out and collar levels, settlement monitoring during construction, and as-built survey at completion
Photos from real SPN topographic and coordinate surveys — covering surveys with GNSS / GPS RTK, Total Station, survey drones (UAV), ground control point (GCP) setting and utility pick-up (roads, gas pipelines, railways, high-voltage poles, fire hydrants) in a wide range of site conditions


Choose files to match your design team's software. Coordinates in WGS84 or TM47/TM48, and levels in MSL or an agreed assumed datum
Spot levels, contours, site boundary and structures, ready to open in AutoCAD / Civil 3D
Georeferenced true-scale imagery that overlays directly on drawings or GIS
3D points from photogrammetry or LiDAR with ground points classified
Surface and terrain models for slope and drainage flow analysis
Layers for boundaries, utility lines and structures for ArcGIS / QGIS
Profiles and cross-sections at specified intervals for roads, canals and pipelines
Cut/fill or stockpile volumes with a cut/fill map
Coordinates and levels of control points, with the coordinate system and datum used
Summary of method, instruments, coordinate system and accuracy checks, signed by a COE-licensed engineer
The accuracies below are typical values under normal site conditions. Actual values depend on site conditions, satellite reception and the number of control points
← Scroll to see the full table →
| Service | Instrument | Accuracy | Output | Best for |
|---|---|---|---|---|
| GPS RTK Survey | GNSS Receiver (Radio / NTRIP) | ±1–3 cm | Contour map, coordinates | Large open areas |
| Total Station Survey | Topcon SDR | ±5 mm | Plans, cross-sections | Urban, factories |
| Precise Levelling | Level + staff | Millimetre level | Levels, settlement graphs | BMs, settlement monitoring |
| Drone Photogrammetry | DJI Phantom/Matrice + GCP | ±3–5 cm | Orthophoto, DSM/DTM | Areas >10 rai |
| LiDAR Scanning | LiDAR Sensor | Depends on sensor and flying height | Point Cloud .las/.laz, DTM | Areas with trees/vegetation |
| Bathymetric Single-beam | Echo Sounder + GNSS | ±5–10 cm | Depth map, bed cross-sections | Canals, rivers, bridges |
| Multibeam / Side-scan | Multibeam, Side-scan Sonar | To the IHO S-44 order specified by the project | 3D seabed, sonar imagery | Ports, navigation channels |
| Setting Out | GPS RTK + TS | ±1–3 cm | Construction coordinates | Structure setting out |
| As-built Survey | GPS RTK + TS | ±1–5 cm | As-built drawings | Acceptance, reports |
| Riverbed Survey | Echo Sounder + GPS | ±10 cm | Bed Profile | Scour analysis |
| Cut & Fill / Stockpile | Drone, GPS RTK, LiDAR | Per the accuracy of the surfaces used | Volume m³, cut/fill map | Earthworks, stockyards |
A typical GPS RTK job takes about 3–8 days in total, depending on site size. Read more: How many days does a topographic survey take?
Send coordinates, a Google Maps link or a KMZ boundary file, and tell us how the data will be used, by phone, LINE or email
The engineer selects the survey method (RTK, Total Station, drone, LiDAR or echo sounder), coordinate system and resolution, with a quotation within 24 hours
Set control points and benchmarks, plus GCPs for drone work, tied to the project's coordinate and level reference system
Pick up points with GPS RTK (base–rover via radio or NTRIP, ±1–3 cm) and Total Station, fly the drone or run the survey boat, recording X, Y, Z for every point
Process in AutoCAD Civil 3D or ArcGIS, build a TIN model and contours at 0.25–1 m intervals, produce orthophotos / point clouds and calculate volumes
Check against field check points, then deliver DWG, Shapefile and PDF with a reference coordinate report, certified by a licensed engineer
Survey price depends on site size, survey method and required resolution. Send your site boundary for a free quotation within 24 hours. Nationwide service from our office in Samut Prakan
SPN does not use a fixed price per rai, because sites of the same size may need very different methods and working time. The engineer will propose the most cost-effective method for how the data will be used.
SPN Soil Engineering provides a full range of topographic and engineering survey services with high-precision instruments at millimetre to centimetre accuracy, including GPS RTK, Total Station, automatic levels, UAV/drones, LiDAR and both single-beam and multibeam echo sounders. We support everything from small construction projects to large national infrastructure. Results are delivered as AutoCAD DWG, GIS Shapefile, orthophotos, point clouds and cut & fill earthwork volume reports, with reference coordinate reports to international standards. Work is carried out by SPN's team of COE-licensed engineers with over 20 years of engineering experience — the same team that handles SPN Group's soil investigation and pile testing, so surface survey data and subsurface soil data come together in one place.
Topographic surveys are often done together with soil boring (soil investigation) to obtain both surface data and subsurface soil layers for foundation design. See a real example in the offshore soil boring case study, which also used GPS coordinate survey.
A topographic survey measures the elevation and shape of the terrain to produce a contour map for engineering and construction. A cadastral survey measures the boundaries and area of a land parcel according to the title deed, and is carried out by Department of Lands officers or private surveyors licensed under the Private Surveyors Act B.E. 2535 (1992). SPN does not carry out legal land boundary surveys, but if boundary markers are found on site, their positions can be shown on the topographic map as a design reference (this is not a boundary certification)
GPS RTK suits large open areas with clear satellite signals; it is fast, with ±1–3 cm accuracy. A Total Station suits urban sites or sites with obstructions such as buildings, trees or factories, with ±5 mm accuracy. In practice SPN often uses both together for the best result
It depends on the job. For cut & fill volumes, orthophotos and 3D models, a drone survey at ±3–5 cm is sufficient and much faster. For setting out or as-built work that needs centimetre or millimetre accuracy, GPS RTK or a Total Station is still required
A bathymetric survey measures water depth and the condition of the bed with an echo sounder (an underwater sound instrument). The output is a depth map and bed profiles, used to design bridges and piers, calculate dredging and analyse scour at bridge foundations
Delivered as the client requires: AutoCAD DWG/DXF, PDF maps, Shapefile (.shp) for GIS, orthophoto .tif, 3D point cloud .las/.laz, Excel coordinate reports and a full survey report. Coordinates referenced to WGS84 or Indian 1975 (UTM Zone 47N/48N) as the project specifies
A 1–10 rai site takes 1–2 days of fieldwork and 2–3 days of processing and mapping. Price depends on the survey method, resolution, distance and site complexity. Contact SPN for a free quotation within 24 hours
TM47 (UTM Zone 47N) is used west of longitude 102° E, which covers most of Thailand. TM48 (UTM Zone 48N) is used east of longitude 102°, e.g. most of the Northeast, Sa Kaeo, Chanthaburi and Trat. Both can reference the Indian 1975 Datum (Department of Lands work / older maps) or WGS84 (modern GNSS work). SPN can deliver results in the coordinate system and datum the client needs, including conversion between WGS84 and TM47/TM48
Yes, nationwide across Thailand. We have survey experience in flat terrain, mountains, riversides and coastlines, from projects in Bangkok, the metropolitan area, the Central and Eastern regions to provincial projects across the country. Contact us for a quotation that includes an estimate of travel costs
Yes. Commercial drone flights in Thailand require the pilot to be registered with CAAT (Civil Aviation Authority of Thailand) and the aircraft to be registered with the NBTC, plus additional permission when flying in controlled areas. The SPN team holds all required licences and coordinates site flight permits for clients
Photogrammetry builds point clouds and orthophotos from overlapping photos. It suits open areas, bare earth and work that needs true-colour imagery, at lower cost. LiDAR fires a laser to measure distance directly; some pulses pass through gaps in foliage to the ground, giving true ground levels in plantations, forest or dense vegetation, where photogrammetry usually captures only the tree canopy. Many projects use both methods together
Two surfaces are compared, e.g. existing ground vs design levels, or ground before vs after earthworks, using a TIN or grid model in software such as AutoCAD Civil 3D. This gives cut volume, fill volume and a cut/fill map. Accuracy depends on point density and the accuracy of both surfaces. The volumes are in-situ volumes as measured and do not include soil swell or shrinkage, which the designer must also consider
Yes. Levels are carried by levelling from a benchmark (BM) of the Royal Thai Survey Department or another relevant agency near the project to the project BM, or GNSS heights are converted with a geoid model, which is more convenient but less accurate than levelling. If no benchmark is within a reasonable distance, an assumed level (local datum) agreed with the designer can be used
Single-beam measures depth point by point along the boat's track. It suits canals, rivers, cross-section work and tight budgets. Multibeam sweeps a wide swath of sound to cover the full bed and produce a high-resolution model, suited to ports, navigation channels and inspection around bridge foundations. Side-scan sonar images the bed to find obstructions; it does not measure depth directly